

I used an Atmel ATTiny13A in a project; it only has 8 pins and all are in use. There isn’t much memory (program or data), so debugging can be a challenge…but fortunately, there’s Atmel-ICE to the rescue! The Atmel-ICE (see product page) is inexpensive and can be used to program and debug Atmel SAM (ARM) and AVR targets. To get real value out of it, you need to use it with Atmel Studio: their free IDE built on Visual Studio.
Connector weirdness:
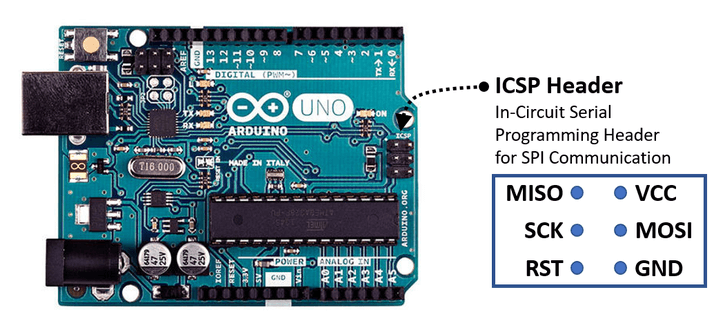
The ICE connects to your PC with a micro-USB cable and to your target with a ribbon

cable (ATATMEL-ICE-CABLE). The cable has both a 10-pin 50-mil JTAG connector and a 6-pin 100-mil SPI ICSP/DW connector configured for the standard AVR ICSP pinout. The red wire on the cable denotes JTAG pin 1; when connecting to an AVR ICSP header the red wire connects to pin 3 (SCK). Strangely, the pin 1 indicator on the 6-pin plug does not denote pin 1 but actually connects to pin 5 (nReset). Anyway, you can trust that the 6-pin connector is correctly wired for the ICSP header (SPI/DW) even though the markings suggest otherwise. Assuming your ICSP header has pin 1 (MISO) in the top left, then the key bump on the plug and the red wire will be on the left side. For examples, see this picture showing the connection to an Uno or this closeup showing the connection to a Mega.
Unlike most of the ICSP programmers, the ICE does not supply power to the target; the power pin (2) is just used to detect the target voltage. The green LED near the edge ICE enclosure indicates target power. This is unfortunate as it makes it much less useful as a programmer, but it allows it to work with both 3v3 and 5V targets. (I would have preferred if they had added a target voltage switch and a 3v3 regulator)
You can use the ICE in two connection modes: ICSP (SPI) for flashing the target only or serial debugWIRE (which is where the really neat stuff happens). DebugWIRE is Atmel’s one-wire in-circuit debugging solution using only the reset pin! In this mode, you can connect to your target, set breakpoints, examine variables (sort of), step through code, and do real source-level debugging while still using all of the pins on your target. Kudos to Atmel…this is really slick…and it works! (Note: you have to set the debugWIRE enable fuse on the target – Atmel Studio will prompt you to do this). Don’t forget to clear that fuse when you’re done debugging!
Atmel studio works well; you add your files into the Solution Explorer, build, and start debugging! The only really annoying thing is that the debugger doesn’t let you examine variables that have been optimized away by the compiler (and you usually need to build with the code optimized because there is so little code space)…so if you want to examine variables, you need to make them global.
Some good references:
- http://www.crash-bang.com/debug-atmel-ice/
- https://wspublishing.net/avr-c/arduino-uno-atmel-ice-connection/
- https://wspublishing.net/avr-c/arduino-mega-atmel-ice-connection/